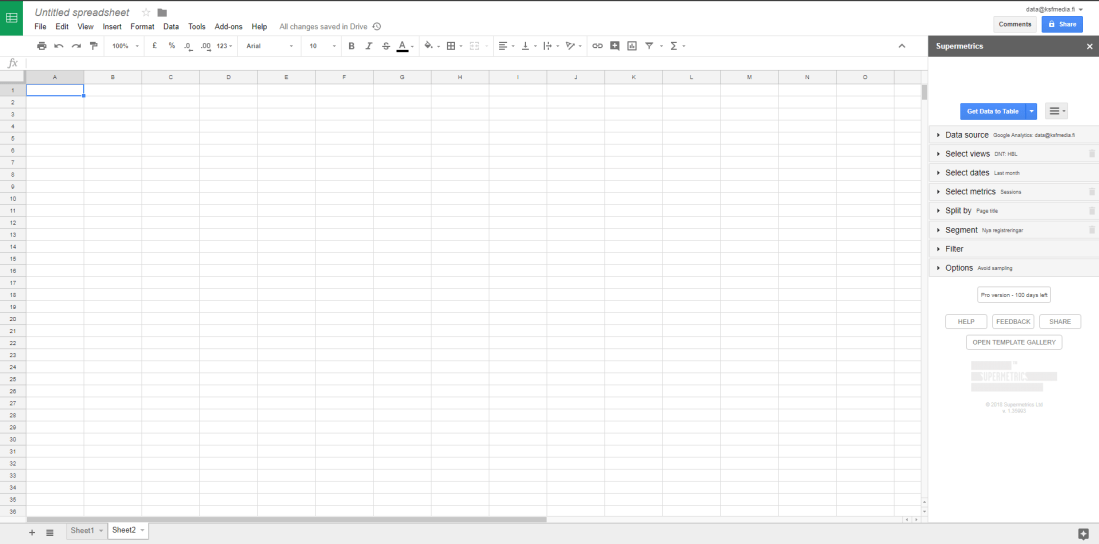
For a news site understanding the analytics is essential. The basic reporting provided by Google Analytics (GA) gives us good tools for monitoring the performance on a daily bases. Even the standard version of GA (which we use) offers a wide variety of reporting options which carries you a long way. However, when you have exhausted all these options and need more, you can either use some kind of tool like Supermetrics or then query the GA api directly. For the latter purpose, I’m using R.
Querying GA with R is a very powerful way to access the analytics data. Where GA only allows you to use two dimensions at the same time, using R you can query several dimensions and easily join different datasets to combine all your data into one large data set that you then can use for further analysis. Provided you know R of course – otherwise I suggest you use a tool like the above mentioned Supermetrics.
For querying GA with R I have used the package RGoogleAnalytics. There are other packages out there, but as for many other packages in R, this is the one I first stumbled upon and then continued using… And so far, I’m quite happy with it, so why change?!
Setting up R to work with GA is quite straight forward, you can find a nice post on it here.
Recently I needed to query GA for our main site’s (hbl.fi, a newssite about Finland in swedish) different measures such as sessions, users, pageviews but also some custom dimensions including author, publish date etc. The aim was to collate this data for last year and then run some analysis on it.
I started out querying the api for the basic information: date (for when the article was read), publish date (a custom dimension), page path, page title and pageviews. After this I queried several different custom dimension one by one and joined them in R with the first dataset. This is necessary as GA only returns rows where there are no NA:s. And as I know that our metadata sometimes is incomplete, this solution allows me to stitch together a dataset that is as complete as possible.
This is my basic query:
# Init() combines all the query parameters into a list that is passed as an argument to QueryBuilder()
query.list <- Init(start.date = "2017-01-01",
                  end.date = "2017-12-31",
                  dimensions = "ga:date,ga:pagePath,ga:pageTitle,ga:dimension13",
                  metrics = "ga:sessions,ga:users,ga:pageviews,ga:avgTimeOnPage",
                  max.results = 99999,
                  sort = "ga:date",
                  table.id = "ga:110501343")

# Create the Query Builder object so that the query parameters are validated
ga.query <- QueryBuilder(query.list)

# Extract the data and store it in a data-frame
ga.data <- GetReportData(ga.query, token, split_daywise=T)
Note this in the Init()-function:
- You can have a maximum of 7 dimensions and 10 metrics
- The max.results can (according to my experience) be at the most 99,999 (at 100,000 you get an error).
- table.id is called ViewID in your GA’s admin panel under View Settings
- If you want to use a GA segment* in your query, add the following attribute: segments = “xxxx”
Note this in the GetReportData-function:
- Use split_daywise = TRUE to minimize the sampling of GA.
- If your data is sampled the output returns the percentage of sessions that were used for the query. Hence, if you get no message, the data is unsampled.
* Finding the segment id isn’t as easy as finding the table id. It isn’t visible from within Google Analytics (or at least I haven’t found it). The easiest way to do this is to use the query explorer tool provided by Google. This tool is actually meant to aid you in creating api query UPIs but comes in handy for finding the segment id. Just authorise the tool to access your GA account and select the proper view. Go to the segment drop down box and select the segment you want. This will show the segment id which is in format gaid::-2. Use this inside the quotes for the segments attribute.
The basic query returned 770,000 rows of data. The others returned between 250,000 and 490,000 rows. After doing some cleaning and joining these together (using dplyers join functions) I ended up with a dataset of 450,000 rows. Each containing the amount of readers per article per day, information on category, author and publish date as well as amount of sessions and pageviews for the given day. All ready for the actual analysing of the data!