Configuration error in Data Studio

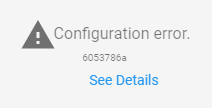
Suddenly, one day, several of the dashboards I had created in Data Studio crashed. They only showed a grey are with the not so encouraging information about a configuration error:

config_error1

Normally I encounter this when the google account I use for creating the dashboard has been logged out for some reason. But this was not the case this time. So I followed the instructions…

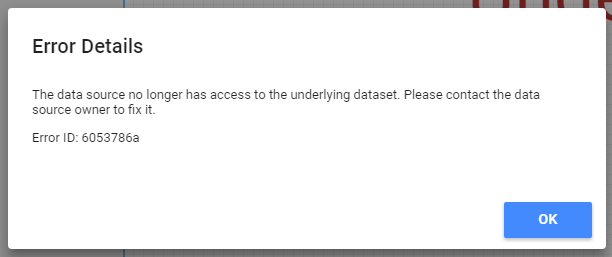
Clicking on See Details the told me that the problem had something to do with the connection to the data. Alas, contacting the data source owner would not be of any help as the data source owner happens to be yours truly, and I was sure that I hadn’t made any changes to the data source.

config_error2

At this point I was starting to become a little bit alarmed. What could have happened to the data source?

I decided to open the data source (from the pen-like icon next to the name of the data source):

config_error3

This then in turn opened a slightly more informative, and certainly more encouraging, dialogue box:

config_error4

Interestingly enough, I had not made any changes to the data source. The data source being Google Big Query and the owner of the data being this very same account since the beginning of this setup. I cannot really imagine what had caused this hickup in the connection, but it was indeed solved by “reconnecting” to the source. First clicking reconnect in the above dialogue box and then once again in the pane that opens:

config_error5

After this you click “Finished”:

config_error6

So in the end, all dashboards are now again up and running, although it was somewhat annoying having to go through all dashboards and “reconnect” to a data source I already am the owner of.

config_error7


Advertisement

Analysing the wording of the NPS question

NPS (Net Promoter Score) is a popular way to measure customer satisfaction. The NPS score is supposed to correlate with growth and as such of course appeals to management teams.

The idea is simple, you ask the customer how likely he or she is to recommend your product/service to others on a scale from 0 to 10. Then you calculate the score by subtracting the sum of zeros to sixes from the sum of nines and tens. If the score is positive it is supposed to indicate growth, if it is negative it is supposed to indicate decline.

My employer is a news company publishing newspapers and sites mainly in swedish (some finnish too). Therefore we mainly use the key question in swedish, i.e. Hur sannolikt skulle du rekommendera X till dina vänner? This wording, although an exact mach to the original (How likely is it that you would recommend X to a friend?) seems a little bit clumsy in swedish. We would prefer to use a more direct wording, i.e. Skulle du rekommentera X till dina vänner? which would translate into Would you recommend X to a friend? However, we were a bit hesitant to change the wordin without solid proof that it would not affect the answers.

So we decided to test it. We randomely asked our readers either the original key question or the modified one. The total amount of answers was 1521. Then, using R and the wilcox.test() function, I analysed the answers and could conclude that there is no difference in the results whichever way we are asking the question.

There is some criticism out there about using the NPS and I catch myself wondering every now and again if people are getting too used to the scale for it to be accurate any more. Also, here in Finland there is a small risk that people mix the scale with the scale 4-10 which is commonly used in schools and therefore apply their opinions to their years old impression about what is considered good and what is considered bad. I’d very much like to see some research about it.

Nevertheless, we are nowaday happily using the shorter version of the NPS key question. And have not found any reason why not to. Perhaps it could be altered in other languages too?