Switching Supermetrics reports to a new user – some tips and tricks

Recently I was faced with the need to switch a bunch of Supermetrics reports (in Google Sheets) to another user. How this is done is perhaps not the most obvious thing, but not at all hard after you figure it out.

This is how you do it:

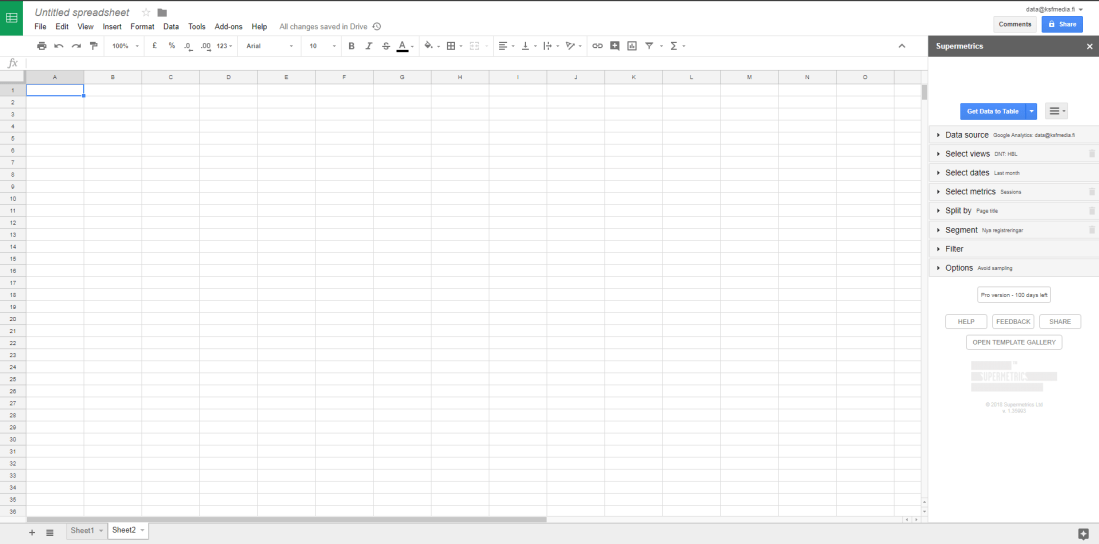
  1. Open the report and navigate to the sheet called SupermetricsQueries. (If you can’t see this sheet you can make it visible either via the All sheets -button at the lower left hand corner of your Google Sheets or via the add-on menu Supermetrics / Manage queries). On this sheet you’ll find a page with some instructions and a table with  information about the queries in this report.
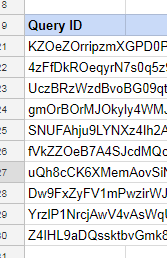
  2. Delete the content in the column QueryID :
    supermetrics_QueryID
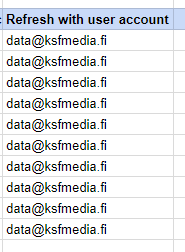
  3. Replace the content in the column Refresh with user account with the correct credentials. E.g. if we talk about Google Analytics this is the email of the account you want to use, if it is Facebok it is a long numerical id.
    supermetrics_RefreshWithUserAccount
  4. Navigate to the Supermetrics add-on menu and choose Refresh all.
  5. Be sure to check the results in the column Last status to ensure that all queries were updates as planned.
    supermetrics_LastStatus
  6. Then, check the data in the reports themselves.
  7. When you’re done I suggest you hide the sheet SupermetricsQueries sheet so that you (or someone you shared the report with) doesn’t alter the specs by mistake.
  8. Don’t forget to transfer the ownership of the file itself if needed!


This is pretty straight forward. Updating a bunch of reports I, however, made the following notes-to-self that I’d like to share with you:

  • Make sure that the account you are using Supermetrics with has credentials to all the data you want to query!
  • Before you start transferring your reports take some time to get acquainted with the content of the reports. Perhaps even make a safety copy of it so that you can be sure that the new credentials and queries are producing the data you expected.
  • When updating the report you probably will want to make some changes to some of the queries. I noticed that when updating many queries it might be easier to update them making changes to the specifications in the table on the SupermetricsQueries sheet instead of using the add-on. Just be careful while doing this!
  • NB! If the original report was scheduled to auto refresh or auto email with certain intervals, you will need to re-do the scheduling. So make sure you know who the recipients of the original report were before you switch the ownership!
Advertisement

Autorefreshing and paginating remote Data Studio dashboards

I’d like to share with you a very nice and handy extension to Chrome, i.e. the Data Studio Auto Refresh extension. With this, you can have your Google Data Studio dashboards autorefreshing and auto paginating on a (remote) screen.

At my workplace we have one screen situated at the news desk. The screen previously showed a Data Studio dashboard with only one page. On this one page we showed the amount of registered users on our site, the NPS for our sites and the most recent comments on a feedback form on the site.

Following Mark Zuckerberg’s announcement last week about prioritising posts from family and friends over posts from pages, we realised we need to have a closer follow up for our Facebook posts as well. So I added a second page to the dashboard that shows Facebook reach and amount of engaged users:

screen_fb

Now the original page alternates with this page every couple of minutes. Thus the news desk can monitor the reach and user engagement of our Facebook posts and hopefully learn what makes Facebook’s algorithms tick. Over time we will of course need to conduct some proper analysis on the performance of the posts but for now this will give us some insight into the performance.

(This screen actually runs on a Raspberry Pi which I manage remotely as I sit on a another floor. Feels like playing with toys but is actually a very good and cheap solution to this simple need.)

Google Analytics and R for a news website

For a news site understanding the analytics is essential. The basic reporting provided by Google Analytics (GA) gives us good tools for monitoring the performance on a daily bases. Even the standard version of GA (which we use) offers a wide variety of reporting options which carries you a long way. However, when you have exhausted all these options and need more, you can either use some kind of tool like Supermetrics or then query the GA api directly. For the latter purpose, I’m using R.

Querying GA with R is a very powerful way to access the analytics data. Where GA only allows you to use two dimensions at the same time, using R you can query several dimensions and easily join different datasets to combine all your data into one large data set that you then can use for further analysis. Provided you know R of course – otherwise I suggest you use a tool like the above mentioned Supermetrics.

For querying GA with R I have used the package RGoogleAnalytics. There are other packages out there, but as for many other packages in R, this is the one I first stumbled upon and then continued using… And so far, I’m quite happy with it, so why change?!

Setting up R to work with GA is quite straight forward, you can find a nice post on it here.

Recently I needed to query GA for our main site’s (hbl.fi, a newssite about Finland in swedish) different measures such as sessions, users, pageviews but also some custom dimensions including author, publish date etc. The aim was to collate this data for last year and then run some analysis on it.

I started out querying the api for the basic information: date (for when the article was read), publish date (a custom dimension), page path, page title and pageviews. After this I queried several different custom dimension one by one and joined them in R with the first dataset. This is necessary as GA only returns rows where there are no NA:s. And as I know that our metadata sometimes is incomplete, this solution allows me to stitch together a dataset that is as complete as possible.

This is my basic query:

# Init() combines all the query parameters into a list that is passed as an argument to QueryBuilder()
query.list <- Init(start.date = "2017-01-01",
                  end.date = "2017-12-31",
                  dimensions = "ga:date,ga:pagePath,ga:pageTitle,ga:dimension13", 
                  metrics = "ga:sessions,ga:users,ga:pageviews,ga:avgTimeOnPage",
                  max.results = 99999,
                  sort = "ga:date",
                  table.id = "ga:110501343")

# Create the Query Builder object so that the query parameters are validated
ga.query <- QueryBuilder(query.list)

# Extract the data and store it in a data-frame
ga.data <- GetReportData(ga.query, token, split_daywise=T)


Note this in the Init()-function:

  • You can have a maximum of 7 dimensions and 10 metrics
  • The max.results can (according to my experience) be at the most 99,999 (at 100,000 you get an error).
  • table.id is called ViewID in your GA’s admin panel under View Settings
  • If you want to use a GA segment* in your query, add the following attribute: segments = “xxxx”


Note this in the GetReportData-function:

  • Use split_daywise = TRUE to minimize the sampling of GA.
  • If your data is sampled the output returns the percentage of sessions that were used for the query. Hence, if you get no message, the data is unsampled.


* Finding the segment id isn’t as easy as finding the table id. It isn’t visible from within Google Analytics (or at least I haven’t found it). The easiest way to do this is to use the query explorer tool provided by Google. This tool is actually meant to aid you in creating api query UPIs but comes in handy for finding the segment id. Just authorise the tool to access your GA account and select the proper view. Go to the segment drop down box and select the segment you want. This will show the segment id which is in format gaid::-2. Use this inside the quotes for the segments attribute.


The basic query returned 770,000 rows of data. The others returned between 250,000 and 490,000 rows. After doing some cleaning and joining these together (using dplyers join functions) I ended up with a dataset of 450,000 rows. Each containing the amount of readers per article per day, information on category, author and publish date as well as amount of sessions and pageviews for the given day. All ready for the actual analysing of the data!


Supermetrics – Easy access to much data!

One nice and very handy tool for extracting data from various sources is an add-on to Google Sheets called Supermetrics. Using it you can access several different data sources, e.g. Google Analytics, Facebook Insights, Google AdWords, Twitter Ads, Instagram and many more. Once installed (and that’s super easy) it opens up as a side bar to your Sheet, like this:

supermetrics_sidebar

Then it’s more or less clicking the right options from the dropdown menus and you have a nice and handy report. Here’s some tips for using Google Analytics with Supermetrics:

1) Make sure that the account you are logged in to Google Sheets (and thus Supermetrics) also has access to the data you want to access.

2) Remember to have you the cell A1 selected before opening Supermetrics or your data will appear in some random corner of your spredsheet.

3) Pay attention when selecting the dates. If you plan to make a report that is auto-refreshing you need to choose the dates using the predefined intervals like today, yesterday, last week, last month, year to date etc. If you chose a custom interval, let’s say January 1st to Janyary 7th, the report will always show the result for these dates even though you ask it to refresh weekly.

4) Split by… rows and/or columns. This is the main benefit compared to querying Google Analytics directly. Here you can specify several dimensions for your data, in GA you only get two.

5) You don’t have to define any segments or filters. If you do, make sure that the account you’re logged in as also has access to these in Google Analytics (and that they are available for the view you are querying).

6) Under options make sure to tick both Add note to query results showing whether Google has used sampling and Try to avoid Google’s data sampling. You’ll see that many times Supermetrics is capable of supplying you with unsampled data where Google itself would give you sampled data.

Here’s a simple example, querying one of our sites for 2017 sessions, splitting the data by operating system and system version:

2017operatingsystems

Nothing spectacular, but very easy to use, easy to share. Absolutely one of my favourite tools!