A week ago on Thursday I attended a meeting for the Tableau User Group in Finland #fintug. There the inspiring Eva Murray (@TriMyData) from Exasol, Tableau evangelist, told us about the concept of MakeoverMonday, and had us do last week’s challenge live, then and there.
I was paired up with Jaakko Wanhalinna (@JWanhalinna) from Solutive in redoing the viz in only 43 minutes. We had a blast, and thanks Jaakko’s good knowledge of Tableau we came up with this nice remake:

You can find the original at my profile on Tableau Public.
Despite some schedule restraints I decided to take on the challenge of this week’s MakeoverMonday viz as well. It’s about the city transport systems in 100 cities globally. The data provided covered only the names of the cities and an index for each city. The higher the index the better. More information about the index can be found at the homepage of Arcadis, a Design and consultancy agency for natural and built assets.
Here’s my viz on the data:
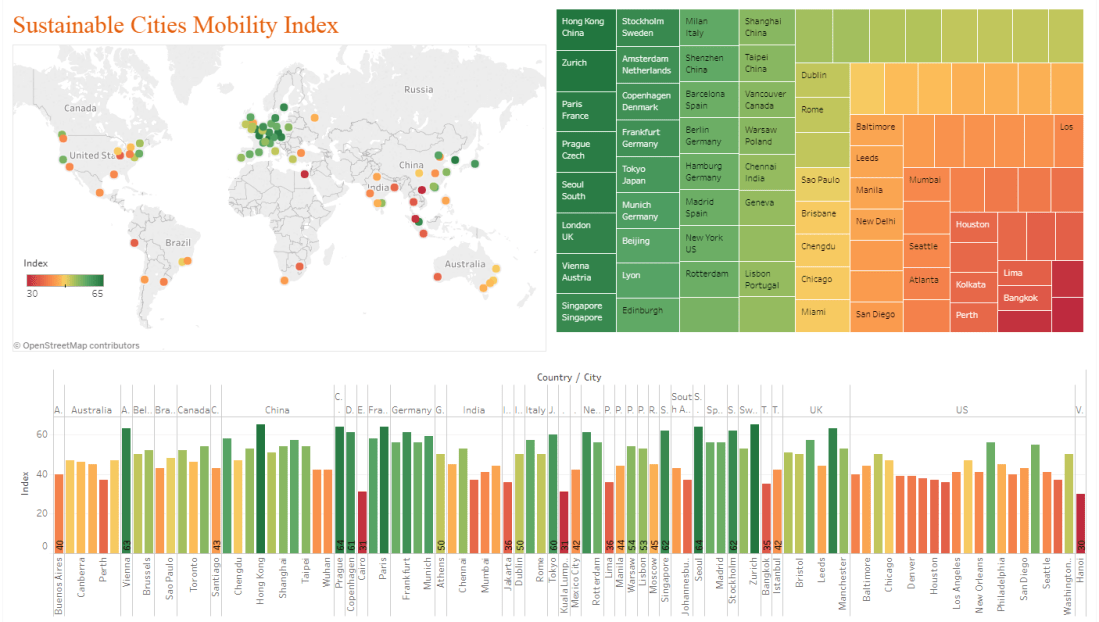
And the original is of course on Tableau Public.
The MakeoverMonday is a fun way to experiment with Tableau and simultaneously learn about very diverse topics, I can highly recommend it! So there will be more of these, maybe not every Monday, but as often as I can squeeze them into my schedule!
